Dose-response in two cell lines
Goal: compare three compounds in HepG2 and A549 cells, each as an 8-point 1:3 dilution, with vehicle and untreated controls on every row.
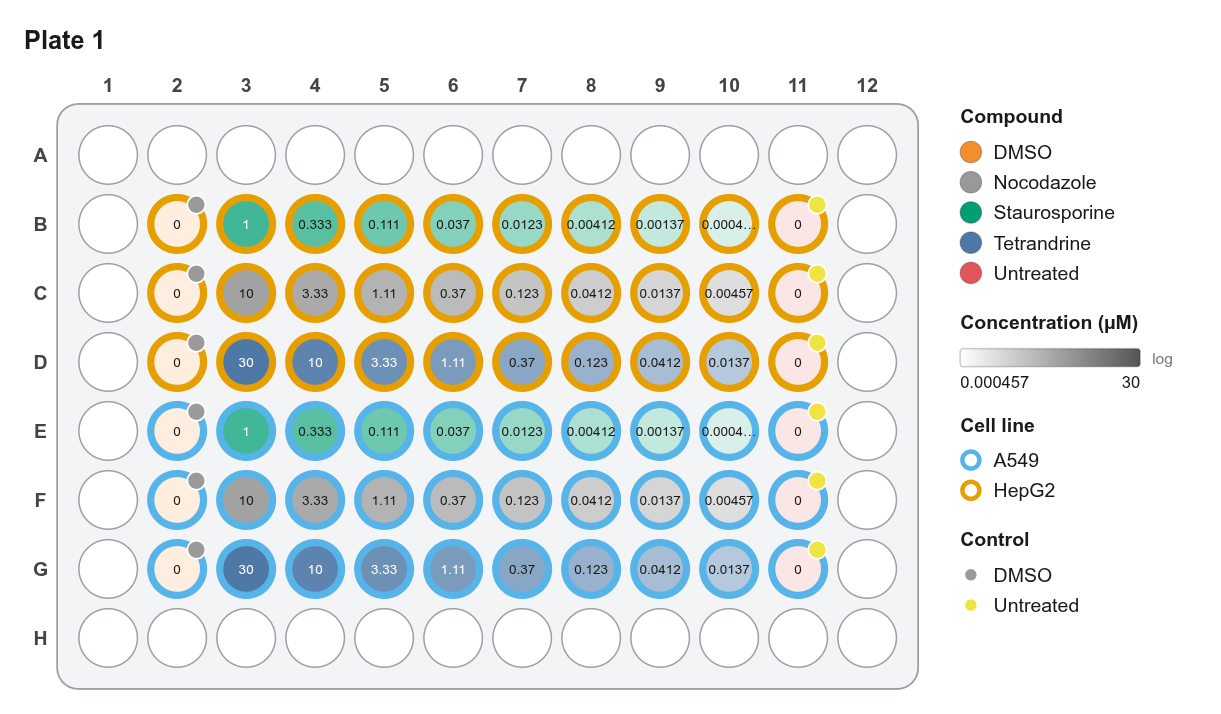
Layout
| Rows | Cell line | Column 2 | Columns 3–10 | Column 11 |
|---|---|---|---|---|
| B, E | HepG2 / A549 | DMSO | Staurosporine 1 µM → 0.46 nM | Untreated |
| C, F | HepG2 / A549 | DMSO | Nocodazole 10 µM → 4.6 nM | Untreated |
| D, G | HepG2 / A549 | DMSO | Tetrandrine 30 µM → 14 nM | Untreated |
Rows A and H and columns 1 and 12 stay empty as an evaporation buffer.
Steps
- New project → 96-well.
- Cell lines: select B2:D11 → Inspector Cell line =
HepG2. Select E2:G11 →A549. - Dilutions: select B3:B10 and E3:E10 together (hold Shift), open Serial dilution, then set Top dose
1 µM, factor3, Across rows, Also set Compound =Staurosporine. Repeat for rows C/F (Nocodazole, 10 µM) and D/G (Tetrandrine, 30 µM). - Vehicle once: select one Staurosporine well and set Vehicle =
DMSO, Compound class =Kinase inhibitor, Treatment group =Treatment. All other Staurosporine wells fill in. Do the same for the other two compounds. - Controls: select column 2 (B2:G2): Compound
DMSO, Concentration0, ControlDMSO, Treatment groupControl. Do column 11 the same way withUntreated. - Layers: Fill = Compound, Fill intensity = Concentration (Log), Ring = Cell line, Corner badge = Control, Text label = Concentration.
- Checks: confirm the list is empty ✓.
- Export: Export → PDF for the figure; Platemap CSV for analysis.
Why a log scale?
Dilution series are spaced geometrically. On a linear scale, everything below the top two doses looks equally pale. On a log scale every step is visibly different.